

Most organisations treat the annual report as a publishing decision.
PDF or digital. Static or interactive. In an era of digital-first communication, many organisations are determining whether to stick with a traditional static PDF or invest in an interactive annual report.
That is the wrong frame. The real question is simpler and more commercial:
How easily can your stakeholders understand what matters?
What is a Static Annual Report?
A static annual report (typically a PDF or printed document) remains the default for many organisations. It is structured, compliant and predictable.
A Static annual report works when:
- reporting requirements are fixed (for example, government or regulated sectors)
- timelines are tight
- print remains necessary
But static formats have a constraint: they are linear. Readers must work to find meaning.
Enter The Interactive Annual Report
Interactive formats, typically delivered via the web, transform what was once a static, compliance exercise into a genuine communication tool. Rather than presenting fixed information, they invite readers to engage on their own terms, by:
- jumping to the sections of greatest relevance
- clicking through to linked data, footnotes, and supplementary material
- watching embedded video from leadership or operational teams
- visualising any data they want.
The more adventurous organisations are going further still. Conversational AI agents, Chat widgets and data visualisation trained on report content now allow stakeholders to pose questions in 50+ languages and get plain English answers. For firms with sprawling operations or intricate financials, this is less a gimmick than a practical solution to an old problem: how to make dense information accessible without dumbing it down.
When the format earns its keep
The case for going interactive is strongest under a particular set of conditions, such as:
- their audience is digitally sophisticated, e.g. institutional investors, analysts, or regulators who expect modern disclosure
- data is rich and complex, and relationships between figures benefit from dynamic presentation
- accessibility matters, as interactive formats offer a credible path to WCAG compliance that print cannot match
- the report’s reach beyond publication day is a priority, with sharing and social distribution in mind
- leadership wants the medium itself to signal transparency and a commitment to innovation.
Underneath the innovation, the logic is straightforward: a report that gets read is more valuable than one that does not.
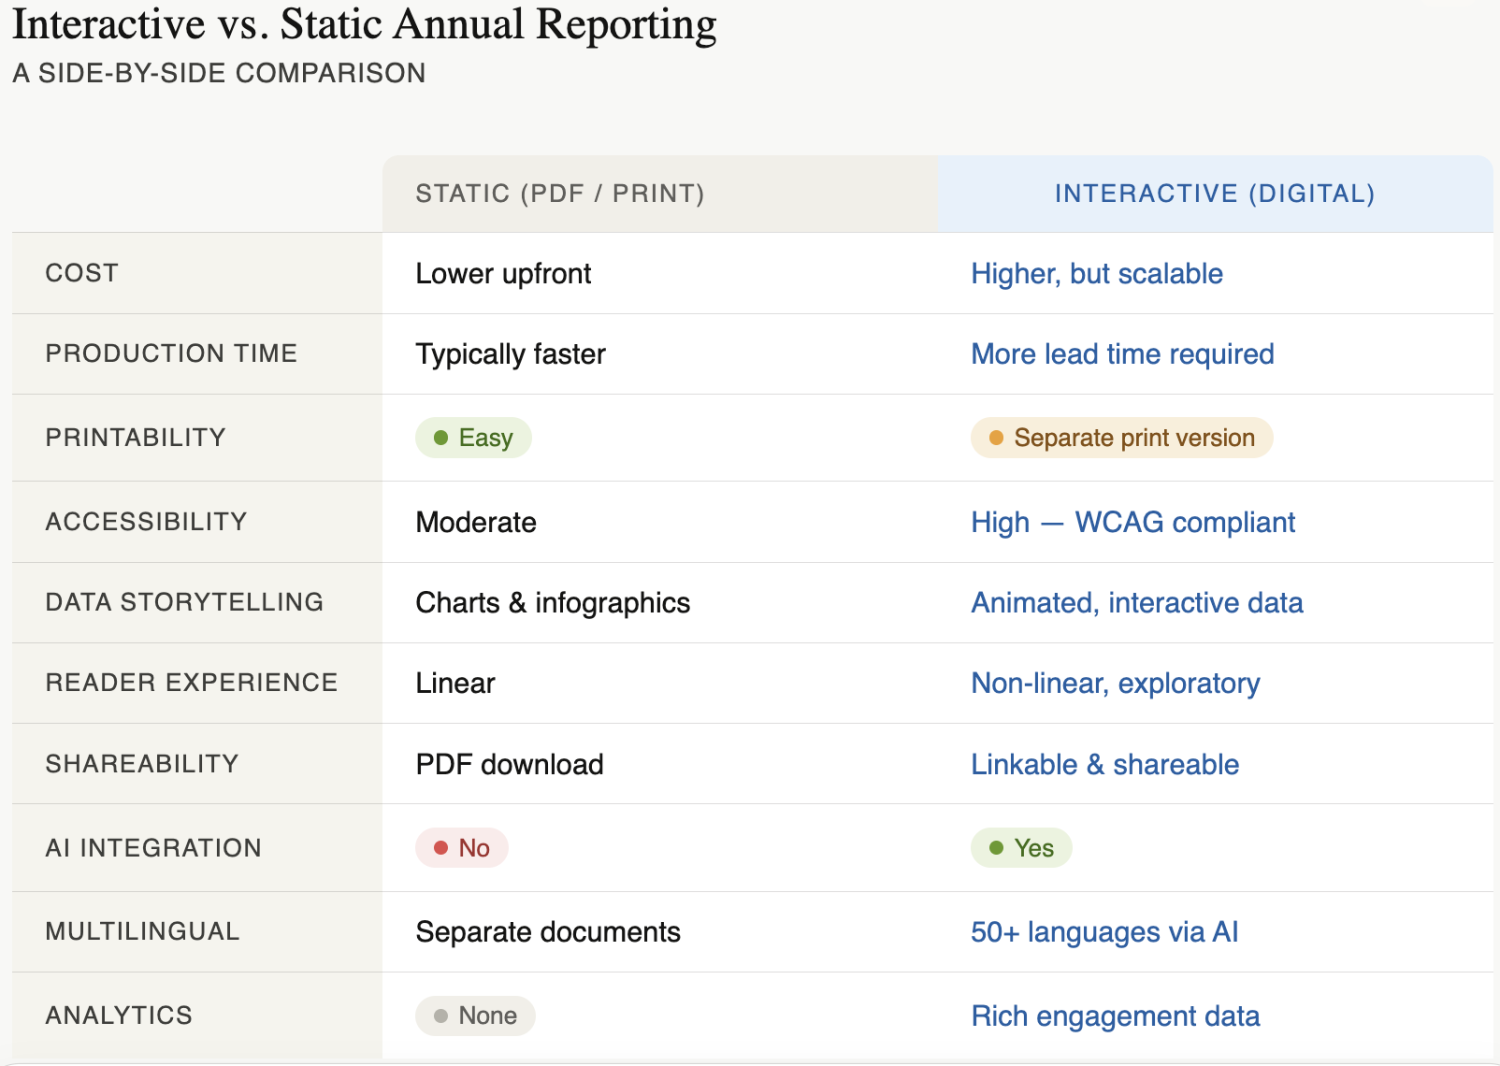
Interactive vs. Static Annual Reporting: Side-by-Side Comparison
The Case for Interactive Annual Reports
A well-crafted interactive report signals something about the organisation behind it: it takes communication seriously and is forward thinking. Rich media — embedded video, animation, interactive charts, and internal hyperlinks — transforms the annual report from an obligation into an asset.
The more consequential innovation, however, is what AI can do for comprehension. Plain-English explanations, surfaced as pop-ups across the report, quietly dissolve the jargon that makes dense documents so forbidding. In government reporting, financial services, and superannuation the gap between what must be written and what readers can readily absorb has long been an unsolved problem.
Done well, this is not a novelty feature. It is a usability layer.
A governed AI interface such as APM’s ReportNavigatorAI allows users to:
- ask questions in plain English
- navigate complex reports instantly
- visualise any data you choose data
- interact in 50+ languages.
Can You Have Both?
Yes. Leading organisations increasingly adopt a dual approach:
- a static report for compliance and a formal record
- an interactive report for usability, access and engagement
This is common across government, regulators and large institutions.
It recognises a simple reality:
Different audiences need different ways to access the same information.
The APM view
At Andrew Pegler Media, we do not start with format.
We start with:
- what the report needs to achieve
- who needs to use it
- where clarity reduces risk
From there, we design a reporting system—editorial, structural and visual—that works across formats.
Interactive layers, including AI, are then applied where they add measurable value.
Because a better annual report is not one that looks more modern.
It is one that’s easier to use, harder to misinterpret, and more valuable to the organisation that produces it.
Get in touch for a no-obligation consultation on your next annual reporting project.